If you operate a WordPress site, encountering a theme or plugin conflicts is almost inevitable. Most of them can be diagnosed without installing additional plugins.
They can offer additional insight, for example by showing SQL queries or active hooks, but they are not needed for basic debugging tasks.
This tool is useful for dealing with the well-known "White Screen of Death." If the white screen shows up, it is a good first option to try.
Debug mode and server logs typically provide enough details to identify whether a plugin, the theme, or custom code is responsible. Extra plugins are rarely necessary for typical PHP warnings or errors.
Debug Mode
Debug mode shows PHP errors and warnings directly on your WordPress site, instead of silently logging them. This does not always mean there is a critical problem.
Some warnings appear even when the code works, usually because it does not fully follow the standards of newer PHP versions.
Debug mode also highlights deprecated functions and hooks from WordPress or third-party plugins. These messages indicate that certain code should be updated or removed. They usually include suggestions for replacement functions to keep the code compatible in the future.
Enabling Debug Mode
By default, WordPress keeps debug mode off for safety. After you finish troubleshooting, it is best to switch it back off.
To enable it, open the wp-config.php file in your root folder and look for this line:
define( 'WP_DEBUG', false );To enable debugging, change false to true. If the line does not exist, you can add it at the end of the file.
define( 'WP_DEBUG', true );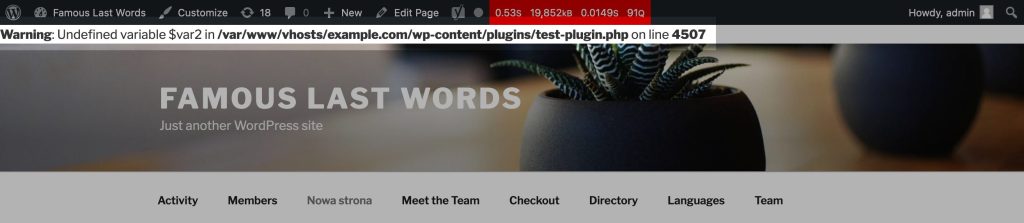
Log File
Running this on a live site risks exposing sensitive backend information. To prevent that and keep errors from showing publicly, you can log them in a separate file and review it later.
This method is also helpful when you want to examine all notices at once or monitor messages created off-screen, such as those from AJAX requests.
Your wp-config.php file should include the debug settings as follows:
define( 'WP_DEBUG', true );
define( 'WP_DEBUG_DISPLAY', false );
define( 'WP_DEBUG_LOG', true );
By default, the log is saved to wp-content/debug.log. You can change the file path by replacing true with your preferred path in the WP_DEBUG_LOG constant.
define( 'WP_DEBUG_LOG', '/var/log/wordpress.log' );Recovery Mode
WordPress introduced recovery mode in version 5.2, released in 2019. Its purpose is to notify administrators when the site experiences a fatal error and to give them backend access.
It activates automatically when a fatal error disabled the site and sends a email notification to the site administrator with a secure link, allowing limited access to the admin dashboard.
When this mode is active, plugins or themes that trigger errors are turned off automatically. Administrators can review them and choose to address the problem, remove the plugin or theme.

Server Logs
Hosting Admin Panels
Some errors do not always show up in the debug mode, depending on how the server is configured. Server logs are usually the most reliable source when diagnosing PHP errors and warnings.
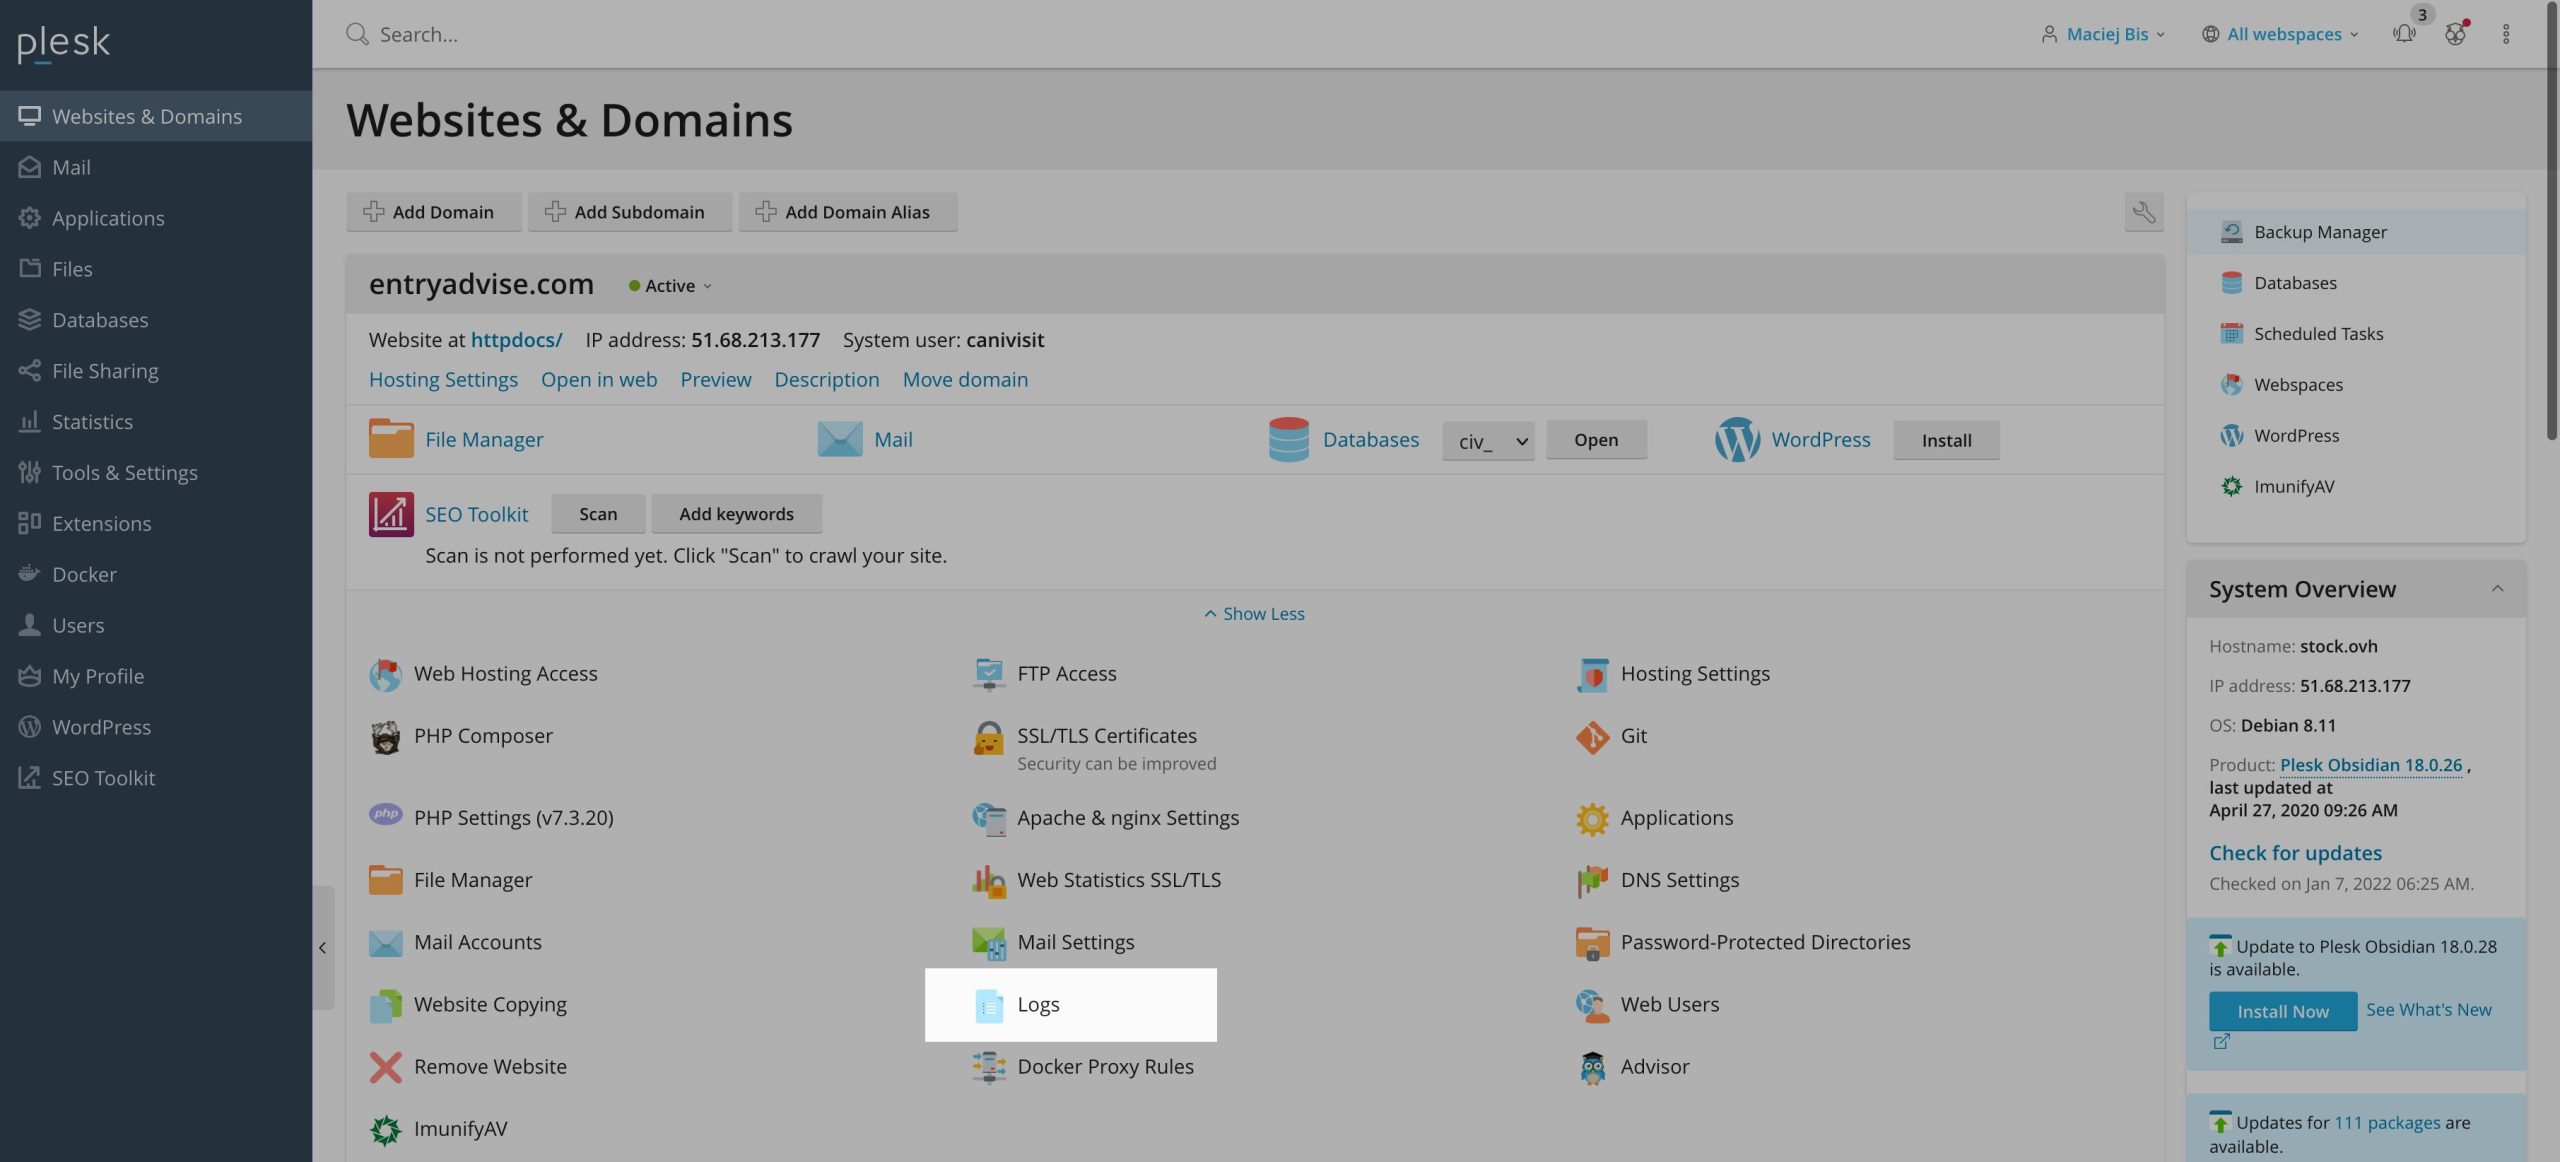
If your host provides Plesk, you can access the PHP error log there in just a few clicks.
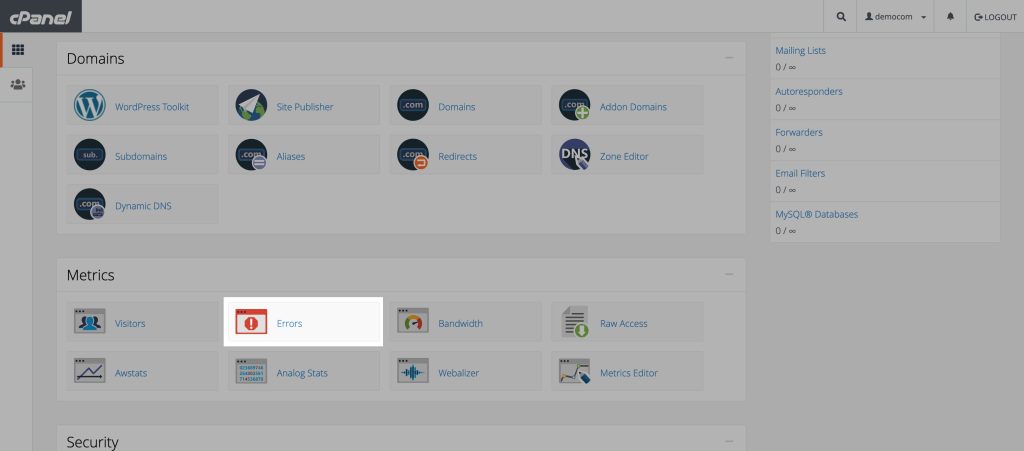
The steps in cPanel are almost the same as in Plesk, and you can access the error log directly from the main dashboard after logging in.
Kinsta
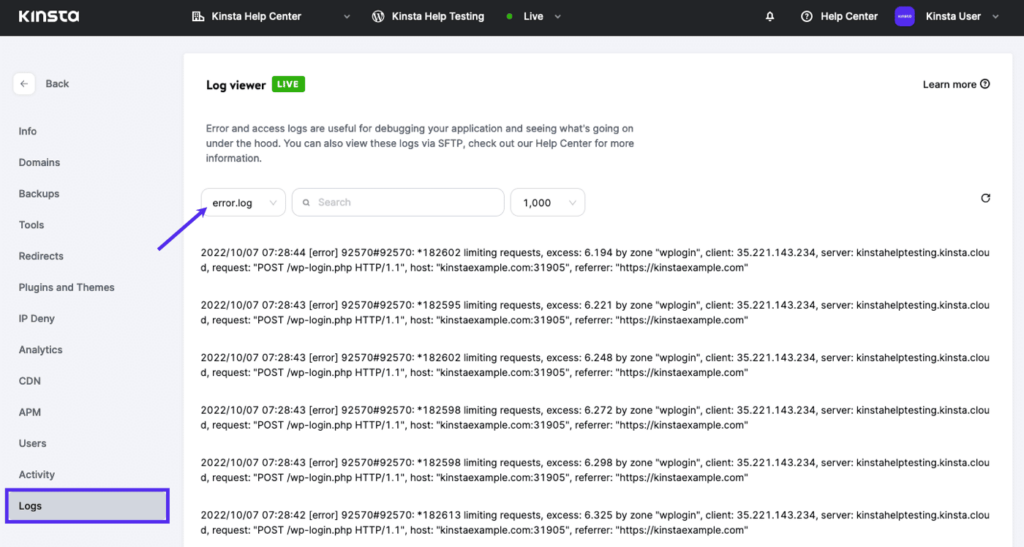
There are several hosting providers designed for WordPress sites, but Kinsta stands out for its reliability. Its admin interface gives users access to detailed debug data and extensive site logs.
With Kinsta, you can enable debug mode in just a few clicks and review PHP errors as they occur in real time.
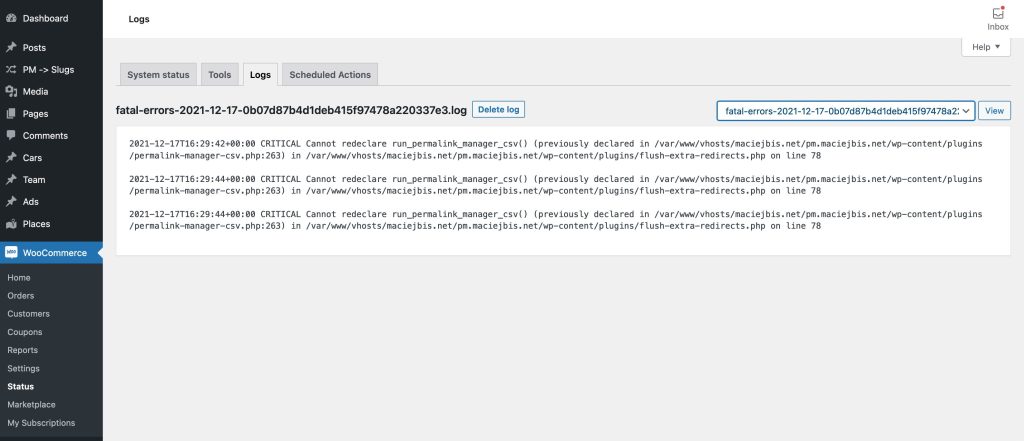
WooCommerce Logs
If you do not have direct access to server logs or cannot turn on debug mode, you can still debug the PHP errors as long as WooCommerce is installed. The "Logs" section under allows direct access to error and event records generated not only by WooCommerce with its extensions but also other plugins.
Fatal errors can often be traced through WooCommerce’s built-in logs. To use them open "WooCommerce -> Status -> Logs" and check the most recent entry. These entries usually trace the function calls leading to the error, which makes it easier to see if a plugin, theme, or custom code is responsible.
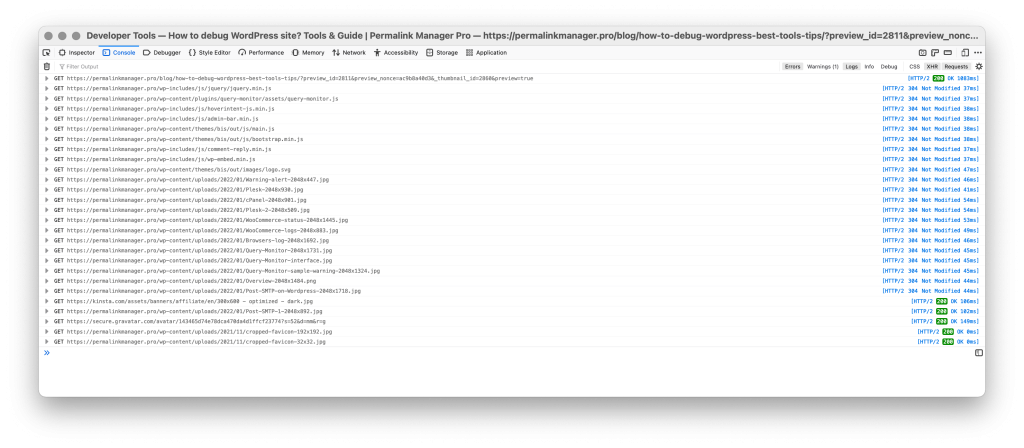
Browser's Console Log
Many site owners do not pay enough attention to front-end code. As a result, the HTML, CSS, and JavaScript produced by their plugins often becomes bloated and poorly structured.
If interactive features like sliders, buttons, or other widgets are not working correctly, it is likely caused by JavaScript errors or conflicts between plugins.
Most modern browsers include developer tools that help identify CSS & JS issues like this. By pinpointing which JavaScript files break your site, you can try disabling the plugin responsible and see if that corrects the problem.
Leave a Reply