WordPress is, without a question, the most widely used content management system today. If you run a WordPress site, you have almost certainly run into a theme or plugin code conflict. Enabling debug mode may assist you in determining why your WordPress site is not functioning properly.
Debug mode, that allows users to access detailed error messages and other debugging information on the frontend of their site, is one of the helpful features of WordPress. If there are bugs or code conflicts on your WordPress site, it might be extremely helpful in diagnosing them.
The 'debug' mode added straight into the WordPress code may be used to address even the most basic of issues, so let me provide some instructions before listing the plugins I recommend. Additionally, server error logs can also be very helpful for troubleshooting issues with a WordPress site. Most web servers keep detailed logs of all errors and other events that occur on the server, and these logs may be used to identify and resolve PHP errors and warnings.
In many circumstances, there is no need to install any plugins in order to detect issues! The tools provided in WordPress, as well as the logs accessible in your server administration panel, might be of use here. If you use one of the most common systems, Plesk or cPanel, I will show you how to find them in this post.
The Role of Debug Mode in WordPress
Debug mode is a built-in tool in WordPress that functions as a detective for your website. It is intended to help you in locating any undetected flaws on your website that may not be apparent at first sight. Enabling debug mode causes it to begin actively monitoring your website and seek for any indications of problems, such as PHP errors or warnings.
Consider debug mode to be a bridge between you and the code of your website. A PHP error can occur anywhere in your website's code, and if you are not familiar with coding, it might be difficult to determine where the problem lies. However, when debug mode is on, it begins to transform these challenging code problems into clearer error messages. These notifications may help you figure out what is wrong, such as if a plugin or a section of code is having issues.
But there are other uses for debug mode than troubleshooting. It is also valuable for anyone who develops themes or plugins for WordPress. Enabling debug mode during the development process allows you to identify and address potential issues before they escalate into larger problems. It is like having a proofreader for your code, ensuring that everything works correctly.
How to Leverage WordPress Debug Mode?
Understanding how and when to make use of Debug Mode may greatly improve your WordPress experience, whether you are debugging difficulties, building a plugin or theme, or preparing for a site launch. Let us take a closer look at these scenarios to see how you may make the most of this tool.
- Troubleshooting Errors:
Enabling debug mode could help you in identifying the underlying cause of issues on your website, such as the white screen of death, 500 internal server errors, or specific functions that are not working as they should. It does this by showing PHP notifications, errors, and warnings right on your website, which might point you to the problematic code or plugin. - Plugin and Theme Development:
Enabling debug mode is a good practice when developing a WordPress plugin or theme. It may assist you in ensuring that your code is clean, efficient, and free of undetected flaws. Deprecated functions, undefined variables, and other possible problems that may not be immediately obvious may all be found in debug mode. By doing so, you can keep up a high level of code standards and avoid future issues. - Before Site Launch:
Activating debug mode is a recommended last step before publishing a new WordPress site. This allows you to identify any last-minute problems that could have gone unnoticed throughout development. Detecting and fixing these problems prior to launching your website will ensure a seamless launch.
How to Debug WordPress Without Any Third-Party Plugin?
Before I list the plugins I suggest, let me explain how to use the built-in WordPress debug mode to identify the most basic problems. Using PHP error logs to debug WordPress plugins and themes is one of the best ways to find out what is wrong.
In order to save server resources, error logs are turned off by default. They may also be a security issue if the logs are presented in the front-end, since they might disclose potential vulnerabilities.
How to Enable Debugging Mode in WordPress?
In general, the process of enabling debug mode may be broken down into three steps.
- Use an FTP client or File Manager to go to WordPress's root directory.
- Find the wp-config.php file in your WordPress installation.
- Set the 'WP_DEBUG' constant to true.
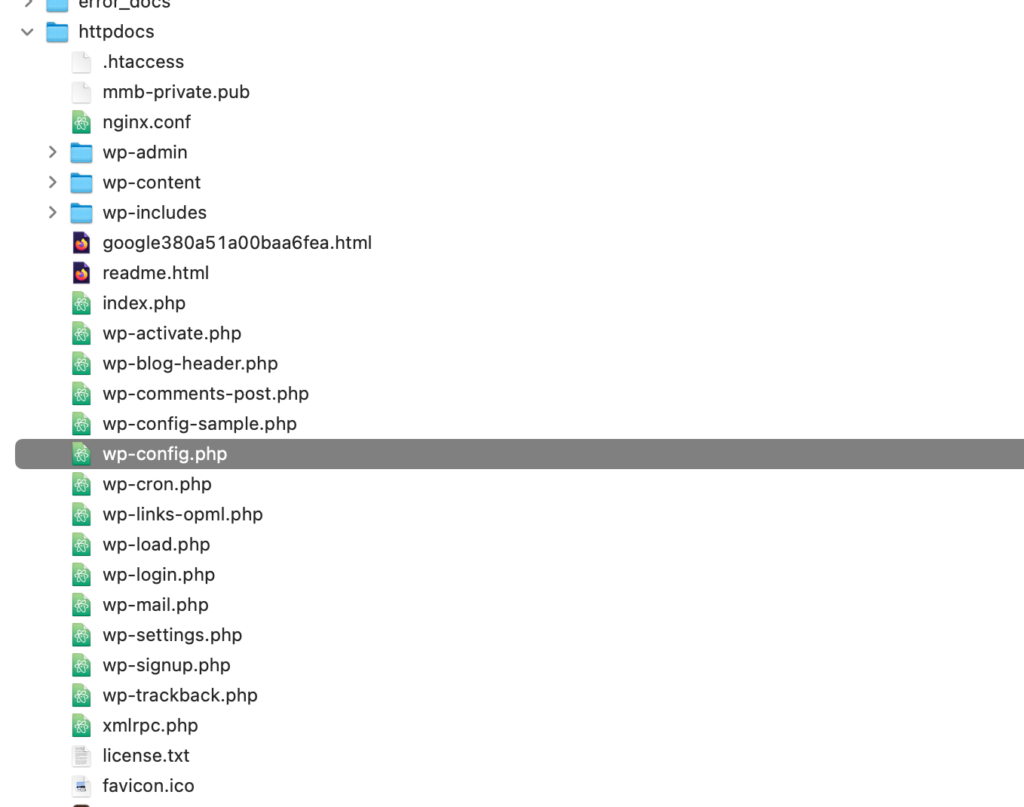
Enabling debug mode in WordPress requires access to the directory where your website is installed through FTP or cPanel/Plesk file management. To utilize this functionality, open the wp-config.php file and locate the line of code shown below.
define( 'WP_DEBUG', false );To use the debugging function, all you have to do is change 'false' with 'true'. If you do not locate it anywhere in wp-config.php, you may add it at the end.
define( 'WP_DEBUG', true );Upon enabling debug mode, all PHP errors, notifications, and warnings will be shown. This may result in warnings being shown for code that is not broken, but do not properly match PHP standards, so please keep that in mind while using this tool.
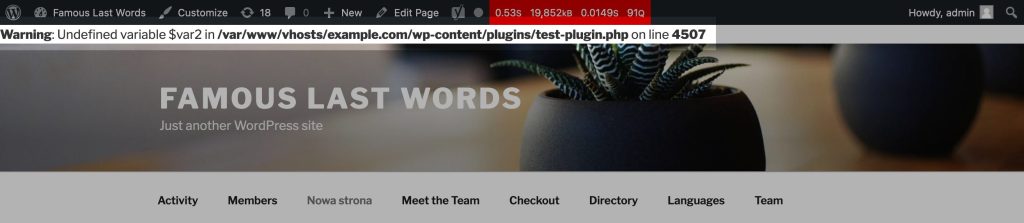
Deprecated functions and hooks used by WordPress or third-party plugins will also be shown in debug mode. They are, to put it simply, functions that are about to be removed from the source code of either a WordPress theme or plugin. Deprecation notices are typically accompanied with a recommendation for a new function to be used in its place.
Accordingly, even if your website does operate to some level, it is still best not to disregard the warnings that are given for security and bug prevention reasons.
Server Logs
Kinsta
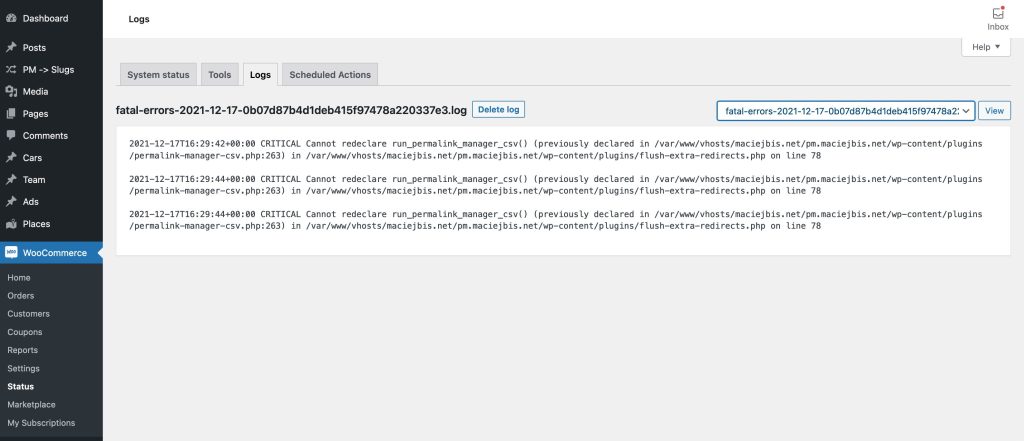
We have already discussed debug mode in WordPress, now let us look at another way to examine PHP error logs for your WordPress website. If you host your website with Kinsta, you can access the admin interface, which contains a huge amount of information about your site.
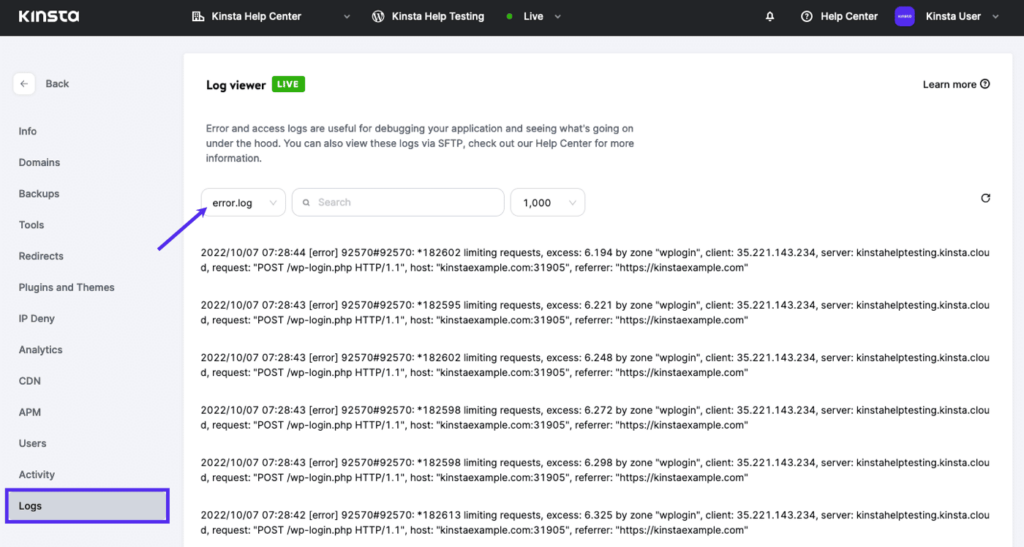
Kinsta not only allows you simply activate debug mode, but it also lets you inspect the PHP errors generated by your website in real time. Understanding how to view these logs might be essential in diagnosing and fixing any issues that may emerge on your website.
To see the error logs from the Kinsta admin dashboard, you need to log in into your Kinsta account. Once you are in, go to the "Sites" area and choose the appropriate site. You will notice a menu on the left-hand side, and from there you must select the "Logs" menu option.
Plesk
If you are having trouble debugging WordPress, the server logs are a great place to start. From my experience, I can tell you that not all problems are logged in WordPress debug mode.
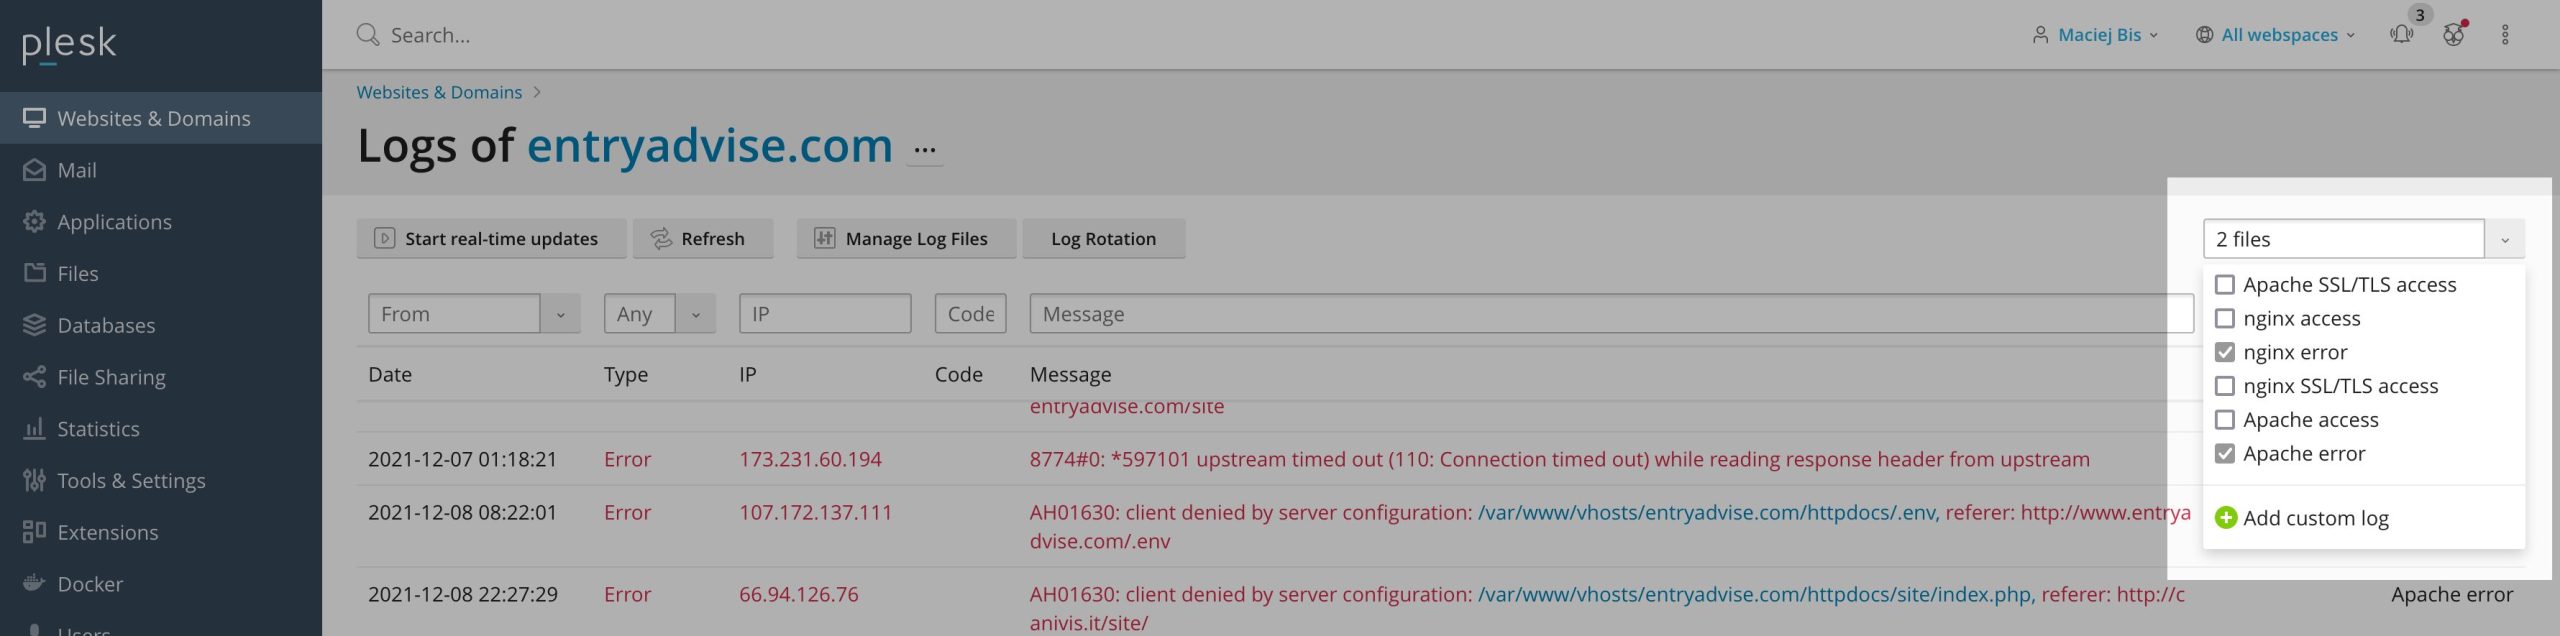
You may also examine the PHP error log in the admin panel if your hosting company uses Plesk. To access it, go to the main panel, choose the domain, and click the "Logs" button.
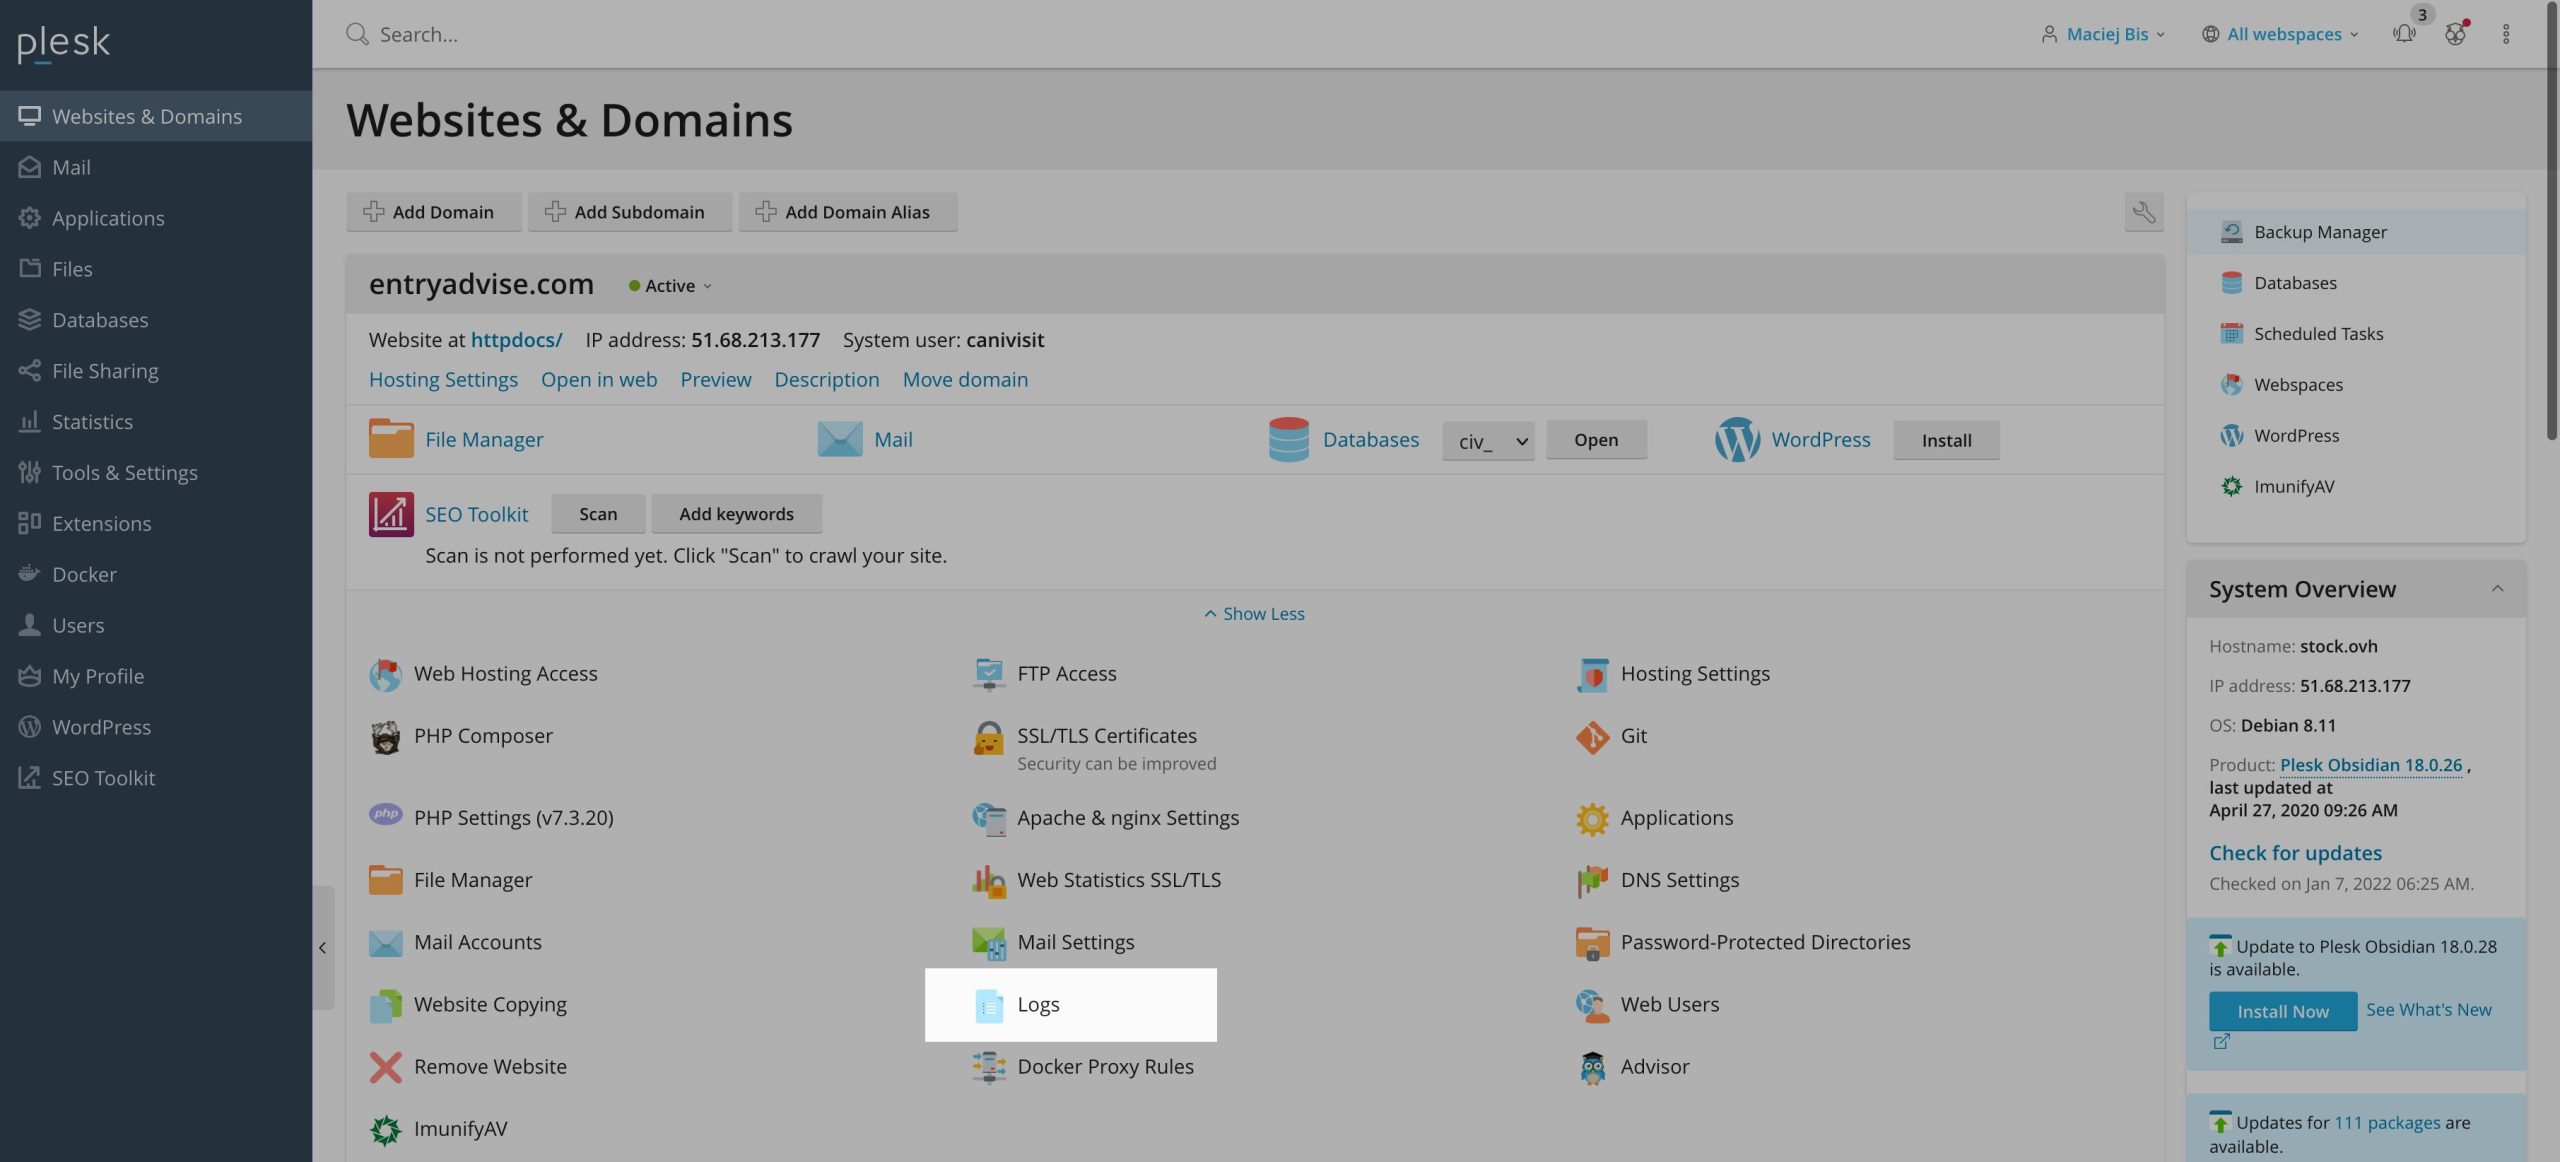
Once the log information has been shown, you may use the dropdown box above to filter the entries to show just the errors.
cPanel
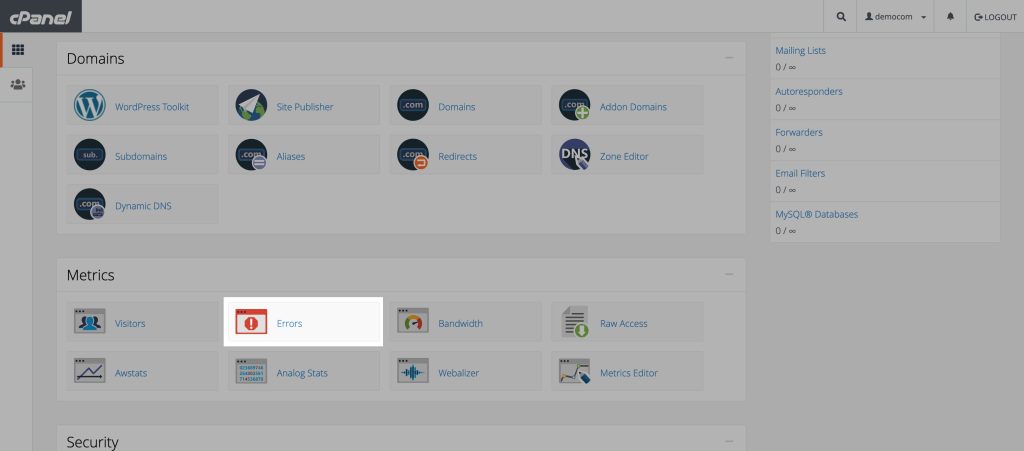
The instructions for cPanel are fairly similar to those for Plesk. Instead of repeating what can be found on Plesk's website, I will just link to it.
WooCommerce Status Report
Not everyone is aware that WooCoomerce may be used to get general information about your server. What is more, the information presented there may be useful even if the problem is not caused by WooCommerce.
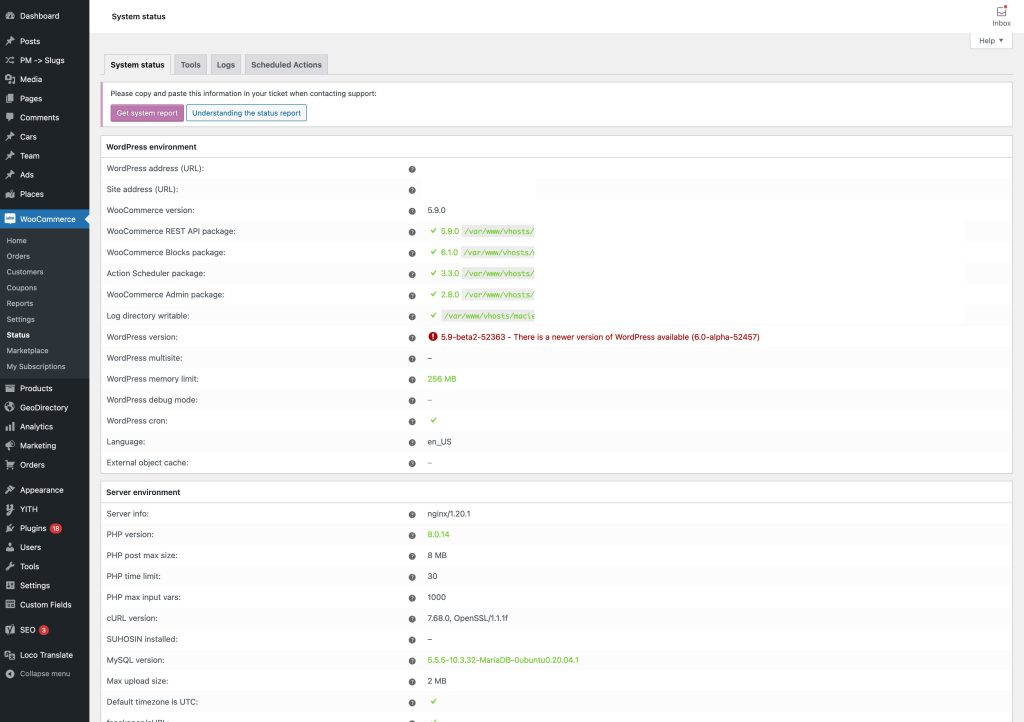
This data can be accessed from the WordPress admin dashboard by going to "WooCommerce > Status" tab. Once on the WooCommerce Status Report page, users can view detailed information about the current status of their WooCommerce installation, including the version of WooCommerce, the current theme and plugins in use, and the server and WordPress environment. The latter may be highly valuable if you need to submit this information to the plugin/theme developer so that they can duplicate your environment and debug the issue you have experienced.
In addition to the overall status information, the WooCommerce Status Report also provides detailed information about specific components of the WooCommerce site, such as the payment gateways, shipping methods, and tax settings. This can be useful for identifying and troubleshooting any potential issues or problems with these components.
Browser's Console and Debugging JS and CSS
Front-end code is often overlooked by WordPress developers. As a consequence, the HTML, CSS, and JS code generated by their plugins is inefficient and poorly written. Generally, using JavaScript to compose the complete web page's content and layout is a bad idea since it makes your site's pages harder to access and less responsive. Another prevalent issue is that certain website components are not consistently supported across browsers, which causes them to screw up for some visitors.
If your interactive functionality is not working properly, it might be due to JavaScript errors or plugin incompatibilities. This might be the situation if the slider, buttons, or other widgets are not functioning properly, for example.
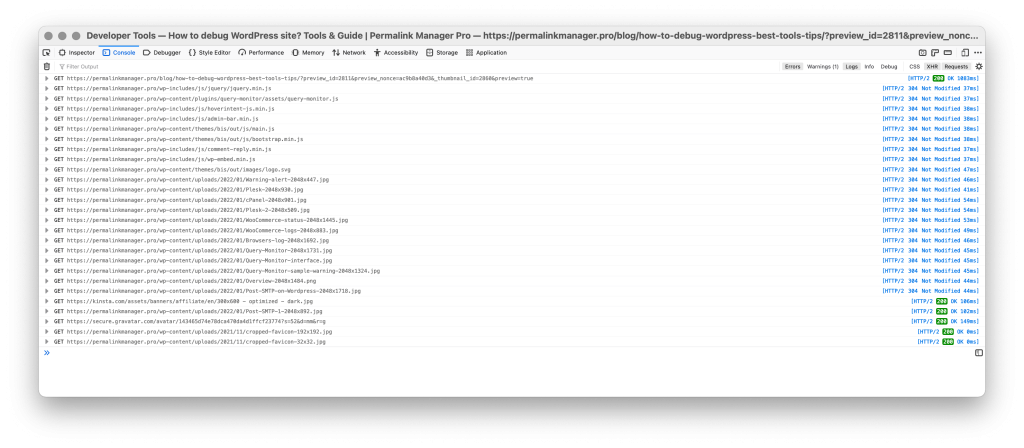
Fortunately, all popular browsers have developer tools that may be used to track out such issues. Attaching a screenshot of your browser's console log when submitting your support request may help the developers in fixing the problem you are experiencing.
You may make live changes to your website's front-end code using the browser developer tools without impacting other users. Using these, you can quickly identify the HTML and CSS code responsible for a certain content element and interact with it using live preview.
Recommended Free WordPress Debugging Plugins
When working with WordPress, it is important to have tools that can help you troubleshoot any problems that may arise. There are many different debugging tools available for WordPress, but some of the most popular and effective ones include the following:
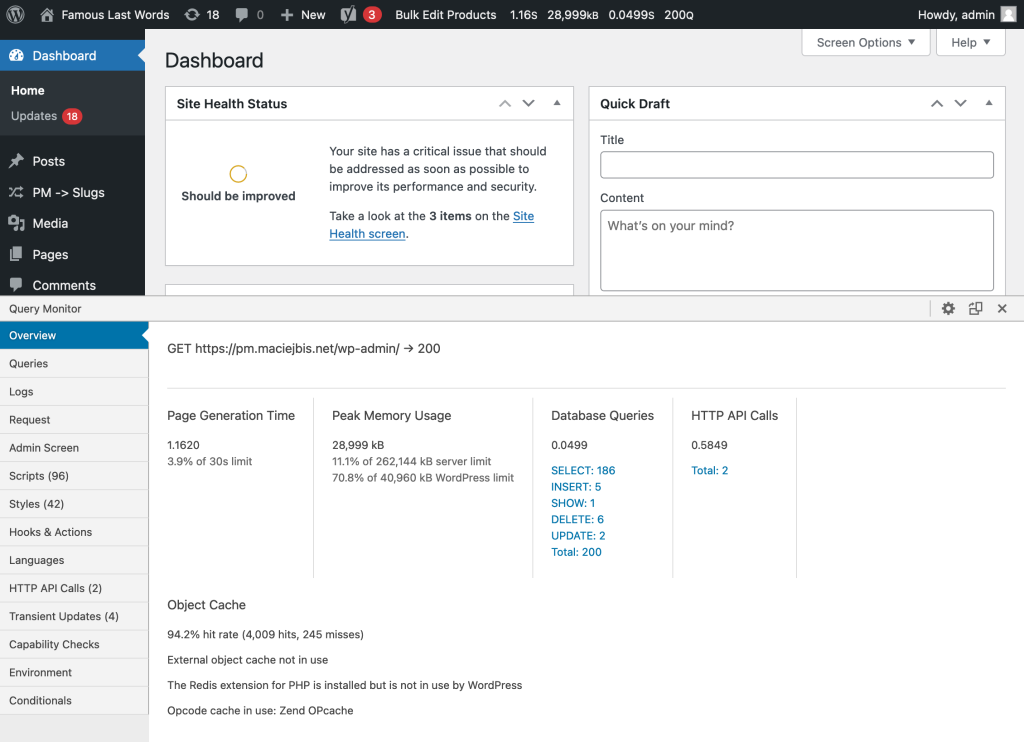
- Query Monitor
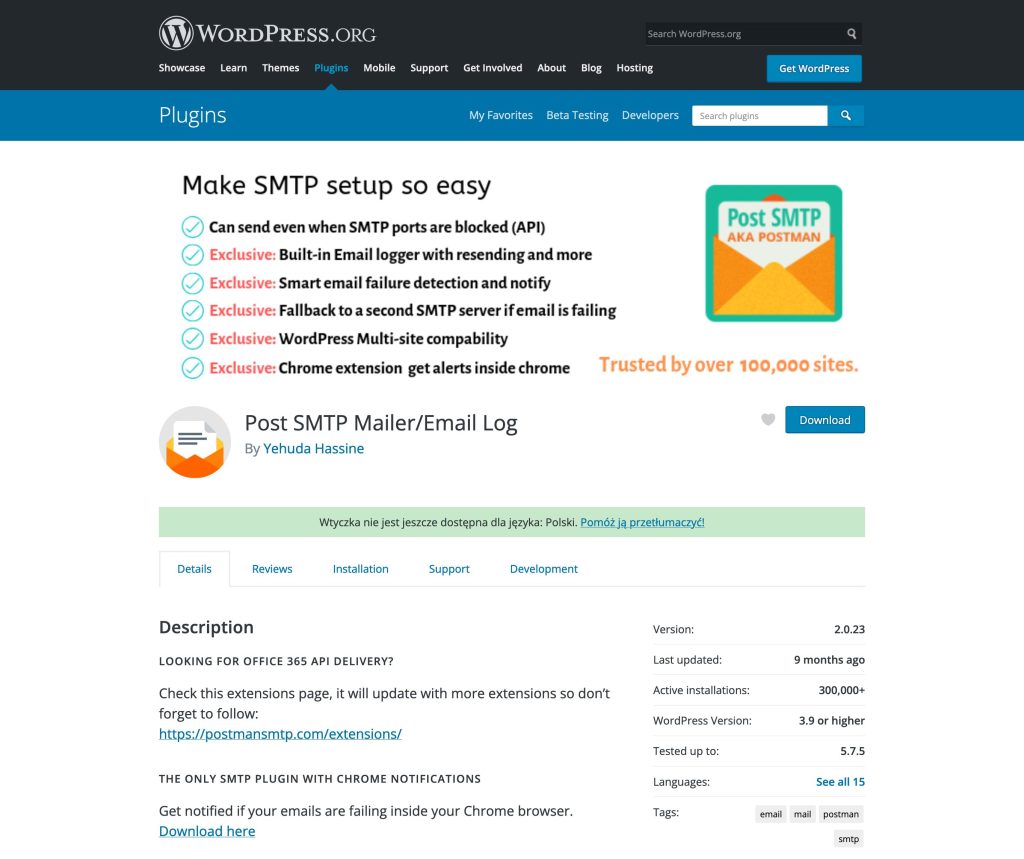
This plugin provides detailed debugging information for WordPress developers, including information about database queries, PHP errors, and hooks and actions. - Post SMTP Mailer/Email Log
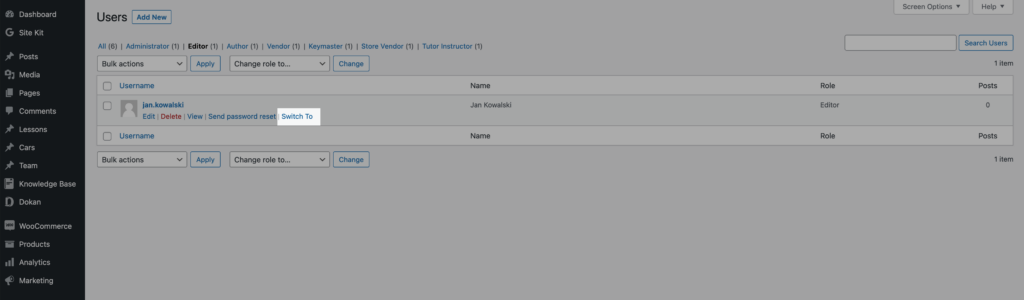
The plugin provides users with a way to send email from their WordPress site using a third-party SMTP (Simple Mail Transfer Protocol) provider, such as Gmail or Mailgun. The plugin also logs all email activity on the site, allowing users to see a record of all email messages that are sent from their WordPress site. - User Switching
The plugin that allows administrators and users with the appropriate permissions to quickly and easily switch between different user accounts on a WordPress site.
Overall, these tools can be very useful for anyone who is working with WordPress and needs to troubleshoot problems or debug their code. It is always a good idea to have a few different debugging tools in your toolkit, so that you can quickly and easily identify and fix any issues that may arise.
Query Monitor
Now that I have given you some insight into the debug tools included in WordPress and WooCommerce, I would like to highlight the first plugin that saved me a lot of time. The Query Monitor plugin is highly recommended by many WordPress developers and businesses, and for good reason.
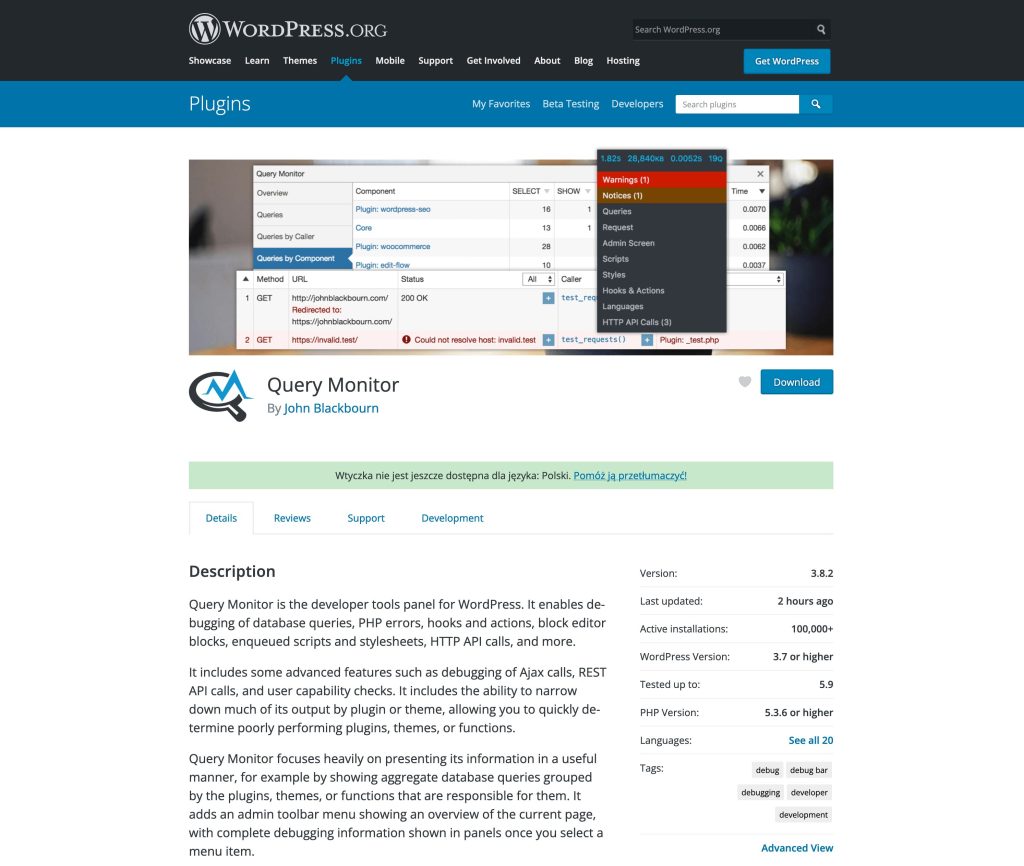
It includes an easy-to-use interface that allows you to quickly identify not just PHP errors, but also issues with queries sent to the database.
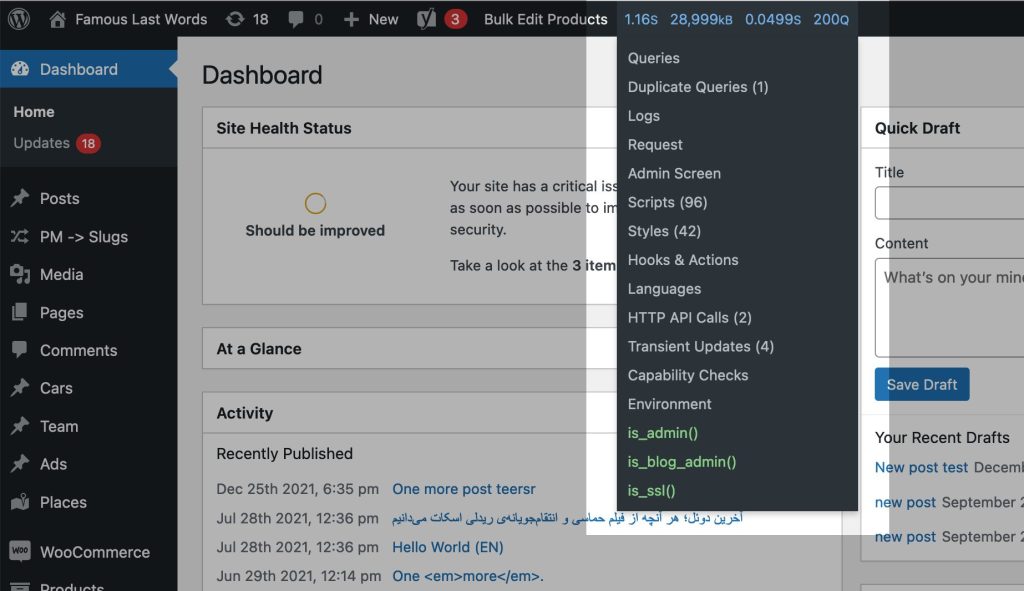
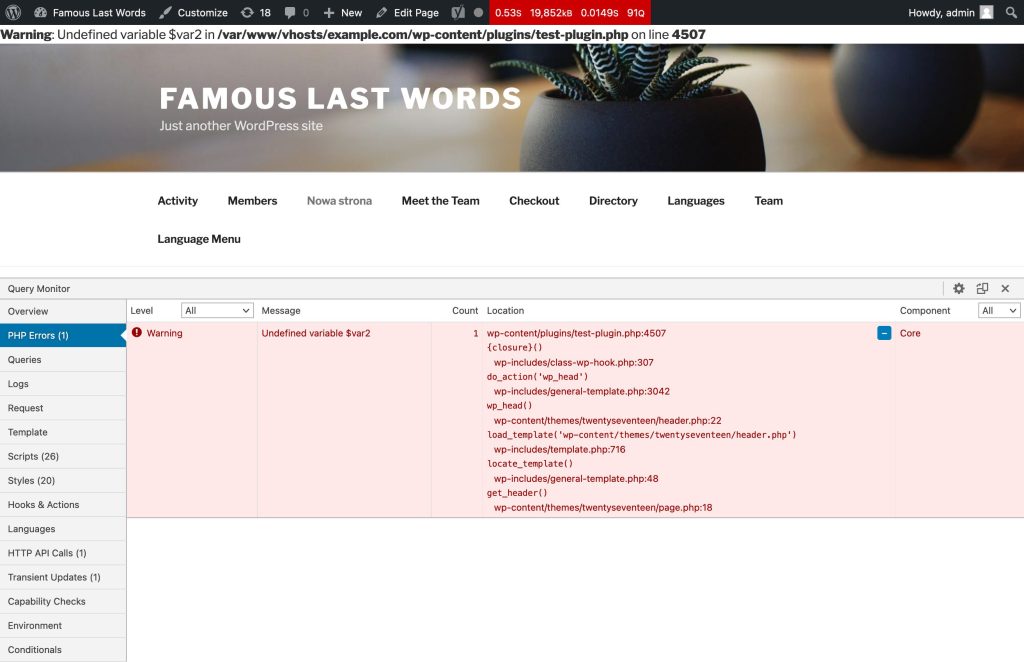
You may also use it to determine which plugin is slowing down or creating troubles on your site. Furthermore, you can also access information about your server on the "Environment" page, similar to the Status Report built into WooCommerce.
Post SMTP Mailer/Email Log
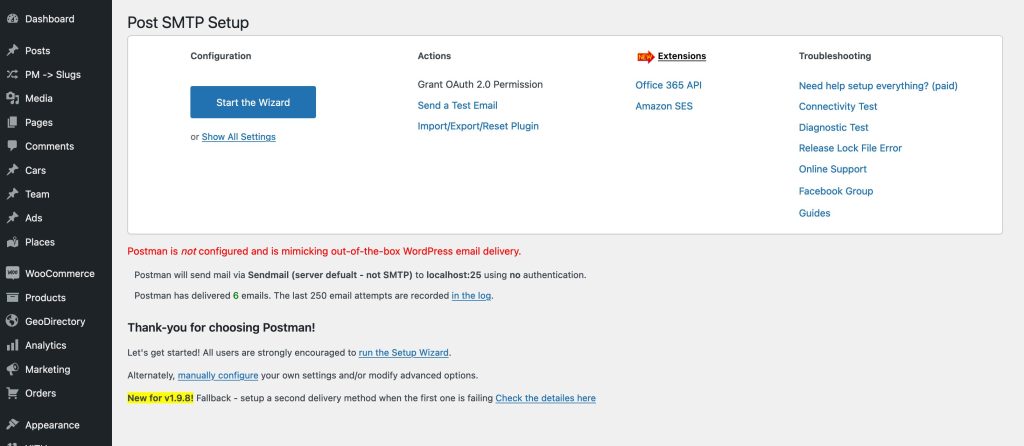
If you moved your WordPress website or built a new one in a fresh environment, the contact forms may not be delivering emails. Your server is most likely not correctly setup to use the PHP mail() function, which is the most likely cause of these frustrating WordPres issue.
If your website is hosted on shared hosting, the mail functionality may be deactivated to decrease the amount of spam. The recipient's server may be blocking messages received from the server for no apparent reason. Whether you have ruled out this scenario, you will need to see if the message has left the outgoing server.
In any case, I recommend using the Post SMTP Mailer/Email Log plugin to track out the source of the issue. It allows you to perform numerous tests and scan your SMTP server for firewall blockages and setup errors. In addition to this, the emails sent via your WordPress website may be logged for troubleshooting purposes.
To be clear, this plugin is not only for troubleshooting the issue of your server not delivering emails. This plugin allows you to configure WordPress to send emails from a third-party server (for example, Gmail) through the SMTP protocol.
User Switching
One of the key features of the User Switching plugin is that it adds a new "Switch To" link to the user list on the WordPress admin dashboard. When clicked, this link allows administrators and other users with the appropriate permissions to switch to a different user account without having to log out and log back in. This makes it much easier and faster to switch between different user accounts, and can be a valuable time-saver for anyone who needs to manage multiple accounts on a WordPress site.
The plugin also provides a number of other useful features, such as the ability to automatically switch back to the original user account when a user logs out, and the ability to switch to other user accounts from the WordPress login screen.
Overall, the User Switching plugin is a useful tool for anyone who needs to manage multiple user accounts on a WordPress site. It provides a convenient way to switch between different user accounts without having to log out and log back in, and can be a valuable time-saver for administrators and other users who need to manage multiple accounts on a WordPress site.
FAQ
Is It Necessary to Install Plugins for Debugging Issues in WordPress?
No, you do not need to install plugins to debug issues in WordPress. WordPress has a built-in debug mode that may be used in order to detect and address problems. You can keep an eye on your website and find issues like PHP errors or warnings by using debug mode.
Dedicated debugging plugins may provide extra features and capabilities, such as extensive error reports and sophisticated debugging tools, although they are not required for basic debugging activities. Keep in mind that the more plugins you have running, the slower your site will run, so only add debugging plugins if you really need them.
What Additional Use Does Debug Mode Serve Besides Troubleshooting?
WordPress's debug mode may be used for more than just debugging. It is useful for anybody working on themes or plugins. Enabling debug mode when developing helps you to discover and fix potential problems before they become serious issues.
Like a human editor, it checks your code to make sure it is error-free. Debug mode helps you in maintaining high code standards by locating deprecated functions, undefined variables, and other possible errors that may not be immediately visible.
Is It Safe to Activate Debug Mode on a Live Website?
It is generally not recommended to activate debug mode on a live website unless you are actively troubleshooting an issue. The debug mode may reveal sensitive information about your website's code and configuration, making it vulnerable to exploitation by malicious actors.
To maintain the security and reliability of your live website, it is advisable to activate debug mode temporarily to identify the particular problem you are experiencing, and then disable it again.
How Can I Use Debug Mode to Fix the “White Screen of Death” Problem?
Debug mode may be a useful tool in resolving the famous "White Screen of Death" issue. When the white screen appears, activating debug mode will reveal error messages that might give insight into the underlying problem.
These error messages often include the name of the particular file or piece of code that is malfunctioning, enabling you to fix the issue immediately.
Does Debug Mode Show Database Connection Errors?
Yes, debug mode may reveal database connection issues. When activated, debug mode shows error warnings about database connections, such as invalid credentials or server problems. You may use the information in the error messages to pinpoint the cause of the database connection failure and take corrective action.
Summary
WordPress's debug mode is a useful tool for identifying and fixing website problems. It helps in troubleshooting by displaying detailed error messages and debugging data on the front end. Access the wp-config.php file and adjust the 'WP_DEBUG' constant to true to enable debug mode.
However, debug mode should be used with care. Disable it after testing or if you do not want people to see sensitive information. Debug mode is useful not just for troubleshooting but also for detecting and resolving potential bugs in theme and plugin development.
WordPress has in-built debugging tools and logs, and although there are third-party debugging plugins, they are not necessary for basic troubleshooting. Overall, debug mode is a useful tool for WordPress users, developers, and those planning to launch a website, providing a smooth and error-free experience.
Leave a Reply